Polish Foundation of OsteoporosisWarynskiego 6/1, 15-461 Bialystok
|
Wersja polska English Version |
AR10 Risk calculator: Evaluating 10 year Individual Absolute Risk of Osteoporotic Fracture
Study Group for the Research on Osteoporosis Epidemiology of the Polish Foundation of Osteoporosis (PFO):
Badurski J.E., Dobrenko A., Nowak N.A., Daniluk S., Jeziernicka E.
Epidemiological research carried out in many European countries and the US, comprising the WHO database, has identified a number of independent fracture risk factors, each sufficient to decrease bone strength and cause fracture after a minor trauma. The probability of fracture after a minor trauma in the next 10 years is calculated on the basis of a medical interview with the patient. The more risk factors involved, the higher the probability of fracture. The following analysis is concerned with the fracture of the hip, as having the most destructive effects.
This is a standard procedure for any chronic disease, in which a long lasting accumulation of adverse processes results in the worst possible, often life-threatening symptoms. In the case of bone – a fracture. A fracture caused not by a major mechanical trauma, but, on the contrary, an everyday trauma, which in advanced age can result in a fracture. In patients suffering from atherosclerosis even a slight stress may lead to a myocardial infarction or stroke, which, consequently, may became fatal incidents.
Understanding those unfavourable conditions, ability to represent them by numbers as well as evaluation of their impact on the patient is a chance to predict such incidents. Obviously, the more information on those factors we have, the more precise will the evaluation be. The amount, nature and impact of those factors are displayed in epidemiological research.
An example. The osteoporotic or atherosterotic process is in progress. We will attempt to establish (using absolute and relative risk coefficients) if medical intervention is needless, advisable or necessary, to either anticipate or prevent a possible myocardial infarction or fracture. We will also decide whether the intervention is cost-effective.
The risk of a myocardial infarction or fracture increases as a result of cell aging and therefore, age itself may cause these conditions. It is called population risk. It concerns each of us even if we consider ourselves healthy. It is cost-effective to prevent a myocardial infarction or fracture in high or very high risk patients. The intervention threshold is determined by patients themselves (having alnalysed their health priorities and risks) as well as the bugdets they have and insurance companies or other parties participating in payment – consequenly the country's financial resources.
Independent factors of fracture risk
They are illustrated by RR – relative risk. It represents how much the risk increases in patients with risk factors (compared to patients free from risk factors). RR = 1.0 means that the particular factor does not affect the analysed process. RR = 0.8 indicates lower risk of fracture. RR = 1.8 or 2.0 means that the risk is higher by 1.8 (80%) or 2.0 (100%) respectively.
Myocardial infarction prediction derived only from total cholesterol levels is quite inadequate. By taking into consideration the effect of medicines, psycho-behavioural characteristics, obesity (waist circumference >102cm), diabetes, high blood pressure, LDL or TG levels, coronary pain, everyday activity and family history of fracture, we are able to assess the risk more precisely.
The same applies to osteoporosis. Fracture prediction based only on BMD tests is inadequate. What makes it more precise is the application of independent factors of fracture risk, identified by studies on fracture epidemiology along with BMD tests. Those risk factors include aging, previous fractures, therapy with glycocorticosteroids, BMI<19, low BMD, alcohol abuse, smoking, rheumatoid arthritis, family history of risk fracture or low physical activity with fall susceptibility. Each of these independent factors of fracture is illustrated by a figure of relative risk. Table 1 shows a standard questionnaire and includes the aboved mentioned factors.
| Risk Factors: | RR |
|---|---|
| BMI [kg/m2] <19 | 1,8 |
| Previous low trauma fracture after 40 | 1,7 |
| Previous femoral neck fracture in parents | 2,2 |
| Secondary osteoporosis (rheumatoid arthritis) | 2,5 |
| Chronic therapy with glycocorticosteroids | 2,3 |
| Smoking | 1,7 |
| Alcohol abuse | 1,7 |
| RR Total |
Low BMD, as well as the other factors, is an independent risk factor and its effect is greater with Z-score lower then average for the age being 0.0. Every standard deviation below Z-score 1.0 means decrease in fracture risk by 1.5. In this particular example (low BMD with Z-score 1.0)=1.5. In other cases it depends on where BMD was tested and is most precise for the particuar bone (as it results from low BMD). It is especially relevant with femoral neck BMD measurement and total hip and fracture in the area. Table 2 shows meta-analysis by Marshall et co. illustrating the relationship between fracture and BMD measurement.
| Forearm Fracture | Femoral Neck Fracture | Spine Fracture | Any Fracture | |
|---|---|---|---|---|
| Forearm (distal) | 1,7 | 1,8 | 1,7 | 1,4 |
| Hip | 1,4 | 2,6 | 1,8 | 1,6 |
| Lumbar Spine | 1,5 | 1,6 | 2,3 | 1,0 |
Long-term prospective trials on fracture epidemiology in Sweden have provided us with data on population risk of fracture (demonstrated in P-AR 10) or hip fracture, as bearing the most serious consequences, and of any fracture. They are included in Table3 and Table4. On the left there is the influence of individual relative risk (in isolation or as their product) on population risk, which grows in every life decade (the upper line at RR = 1.0).
| Men | ||||
|---|---|---|---|---|
| RR | 50 years | 60 years | 70 years | 80 years |
| 1,0 | 0,8 | 1,3 | 3,7 | 9,5 |
| 2,0 | 1,7 | 2,5 | 7,2 | 17,9 |
| 3,0 | 2,5 | 3,7 | 10,6 | 25,3 |
| 4,0 | 3,3 | 4,9 | 13,8 | 31,8 |
| Women | ||||
| RW | 50 lat | 60 lat | 70 lat | 80 lat |
| 1,0 | 0,6 | 2,4 | 7,9 | 18,0 |
| 2,0 | 1,1 | 4,8 | 15,1 | 32,0 |
| 3,0 | 1,7 | 7,0 | 21,7 | 42,9 |
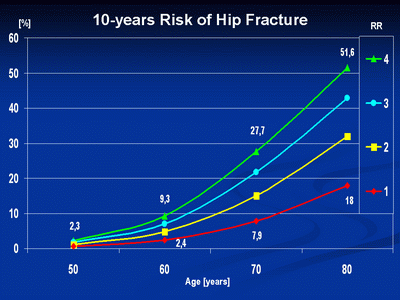
| 4,0 | 2,3 | 9,3 | 27,7 | 51,6 |
| Men | ||||
|---|---|---|---|---|
| RR | 50 years | 60 years | 70 years | 80 years |
| 1,0 | 3,3 | 4,7 | 7,0 | 12,6 |
| 2,0 | 6,5 | 9,1 | 13,5 | 23,1 |
| 3,0 | 9,6 | 13,3 | 19,4 | 13,9 |
| 4,0 | 12,6 | 17,3 | 24,9 | 39,3 |
| Women | ||||
| RW | 50 years | 60 years | 70 years | 80 years |
| 1,0 | 5,8 | 9,6 | 16,1 | 21,5 |
| 2,0 | 11,3 | 18,2 | 29,4 | 37,4 |
| 3,0 | 16,5 | 26,0 | 40,0 | 49,2 |
| 4,0 | 21,4 | 33,1 | 49,5 | 58,1 |
Fig 1. shows the risk of fracture with increasing age and accumulation of relative risk factors.
Employing these tools brings us closer to the estimation of individual risk of fracture in any examined patient.
Examples:
- A 50-year-old woman without any additional risk of facture (see Table 3) has a 0.6 per cent chance of hip fracture in the next 10 years(AR-10=0.6%). If her BMI were lower than 19.0 (RR = 1.8) and she smoked (RR = 1.7), the product of the two RR, 1.8 x 1.7 = 3.06 means threefold higher risk of fracture, from 0.6 to 1.7.
- An 80-year-old woman without any additional risk of facture except age (RR = 18%), a smoker (RR = 1.7), has had a Colles fracture (RR = 1.7). The product of the RR, 1.7 x 1.7 = 2.9, means increase of fracture risk from 18% to about 42%.
Approximate values of AR 10 in women in the 6th, 7th and 8th decade of life are calculated by multiplying RR, or its product, by population risk at a given age with RR = 1.0 (in women from 0.6 at 50 years old to 18.0 at 80 years old, as in Table 3). And so, in example 1, RR 3.06 x 0.6% = 1.8%, but in example 2, (an 80-year-old woman) RR 2.9 x 18% = 52.2%
Fig. 2.
.![[Rozmiar: 43888 bajtów]](images/frc_en_res.png)
AR 10 calculated on the basis of CRF places the patient into one of three groups (as in Fig2.): low risk group requiring no intervention, high risk group, with meadical treatment justified and/or neccessary, which requires no further examination, and medium risk group, where DXA is necessary (preferably of the hip). If BMD is lower than the age norm (Z-score<0.0), then another AR 10 calculation (including BMD) can change the qualification of the patient into a group with neccessary treatment.
Example:
- BMD of femoral neck with Z-score -1.0 (RR 2.6) in the 50-year old women from example 1 increases the product of her RR from 3.06 to 8.0 (3.06 x 2.6). AR 10 increases from 1.7% to 4.8% (8.0 x 0.6%). BMD of femoral neck with Z-score -2.0 (RR 2.6 x 2.6 = 6.7) increases her RR from 3.06 to 24.1 (3.06 x 6.7), and consequently AR 10 increases from 1.7% to 14.5% (24.1 x 0.6).
What decides about the intervention threshold? What is understood by treatment is another matter. The population risk of hip fracture in an 80-year-old woman without any additional risk facture apart from age (see Table 3), that is when BMD is Z-score = 0.0, equals 18%. With a 10% or 14% intervention threshold, 100% of people above that age would require treatment. Still intervention would not apply to people after 60, even burdened with several risk factors (RR = 9.3%).
What is rational is an age-dependent threshold which equals 10% in the 5th decade of life, 15% in the 6th, 20% in the 7th and 25% in the 8th and above.
Calculation of fracture risk
| Top of the page © Copyright Polska Fundacja Osteoporozy |